Predicting stroke (II): Model selection
Second part of the series Predicting stroke.
Description
So far we’ve seen different models and approaches to the problem of classifying people in the “stroke” group and the “no-stroke” group. However, we haven’t compared them yet. In order to make a good decision about which model to choose as best, we must compare them under the most similar conditions. That’s the purpose of this project. The models are fitted and then different performance metrics are computed.
Results
| Model | accuracy | $F_1$ | AUC | Sensitivity | Specificity |
|---|---|---|---|---|---|
| QDA | 0,6331 | 0,0803 | 0,8396 | 0,8876 | 0,6284 |
| Decision tree | 0,7482 | 0,1050 | 0,8118 | 0,8186 | 0,7469 |
| SVM | 0,7218 | 0,0974 | 0,8507 | 0,8314 | 0,7198 |
(In bold type the highest score obtained for each statistic)
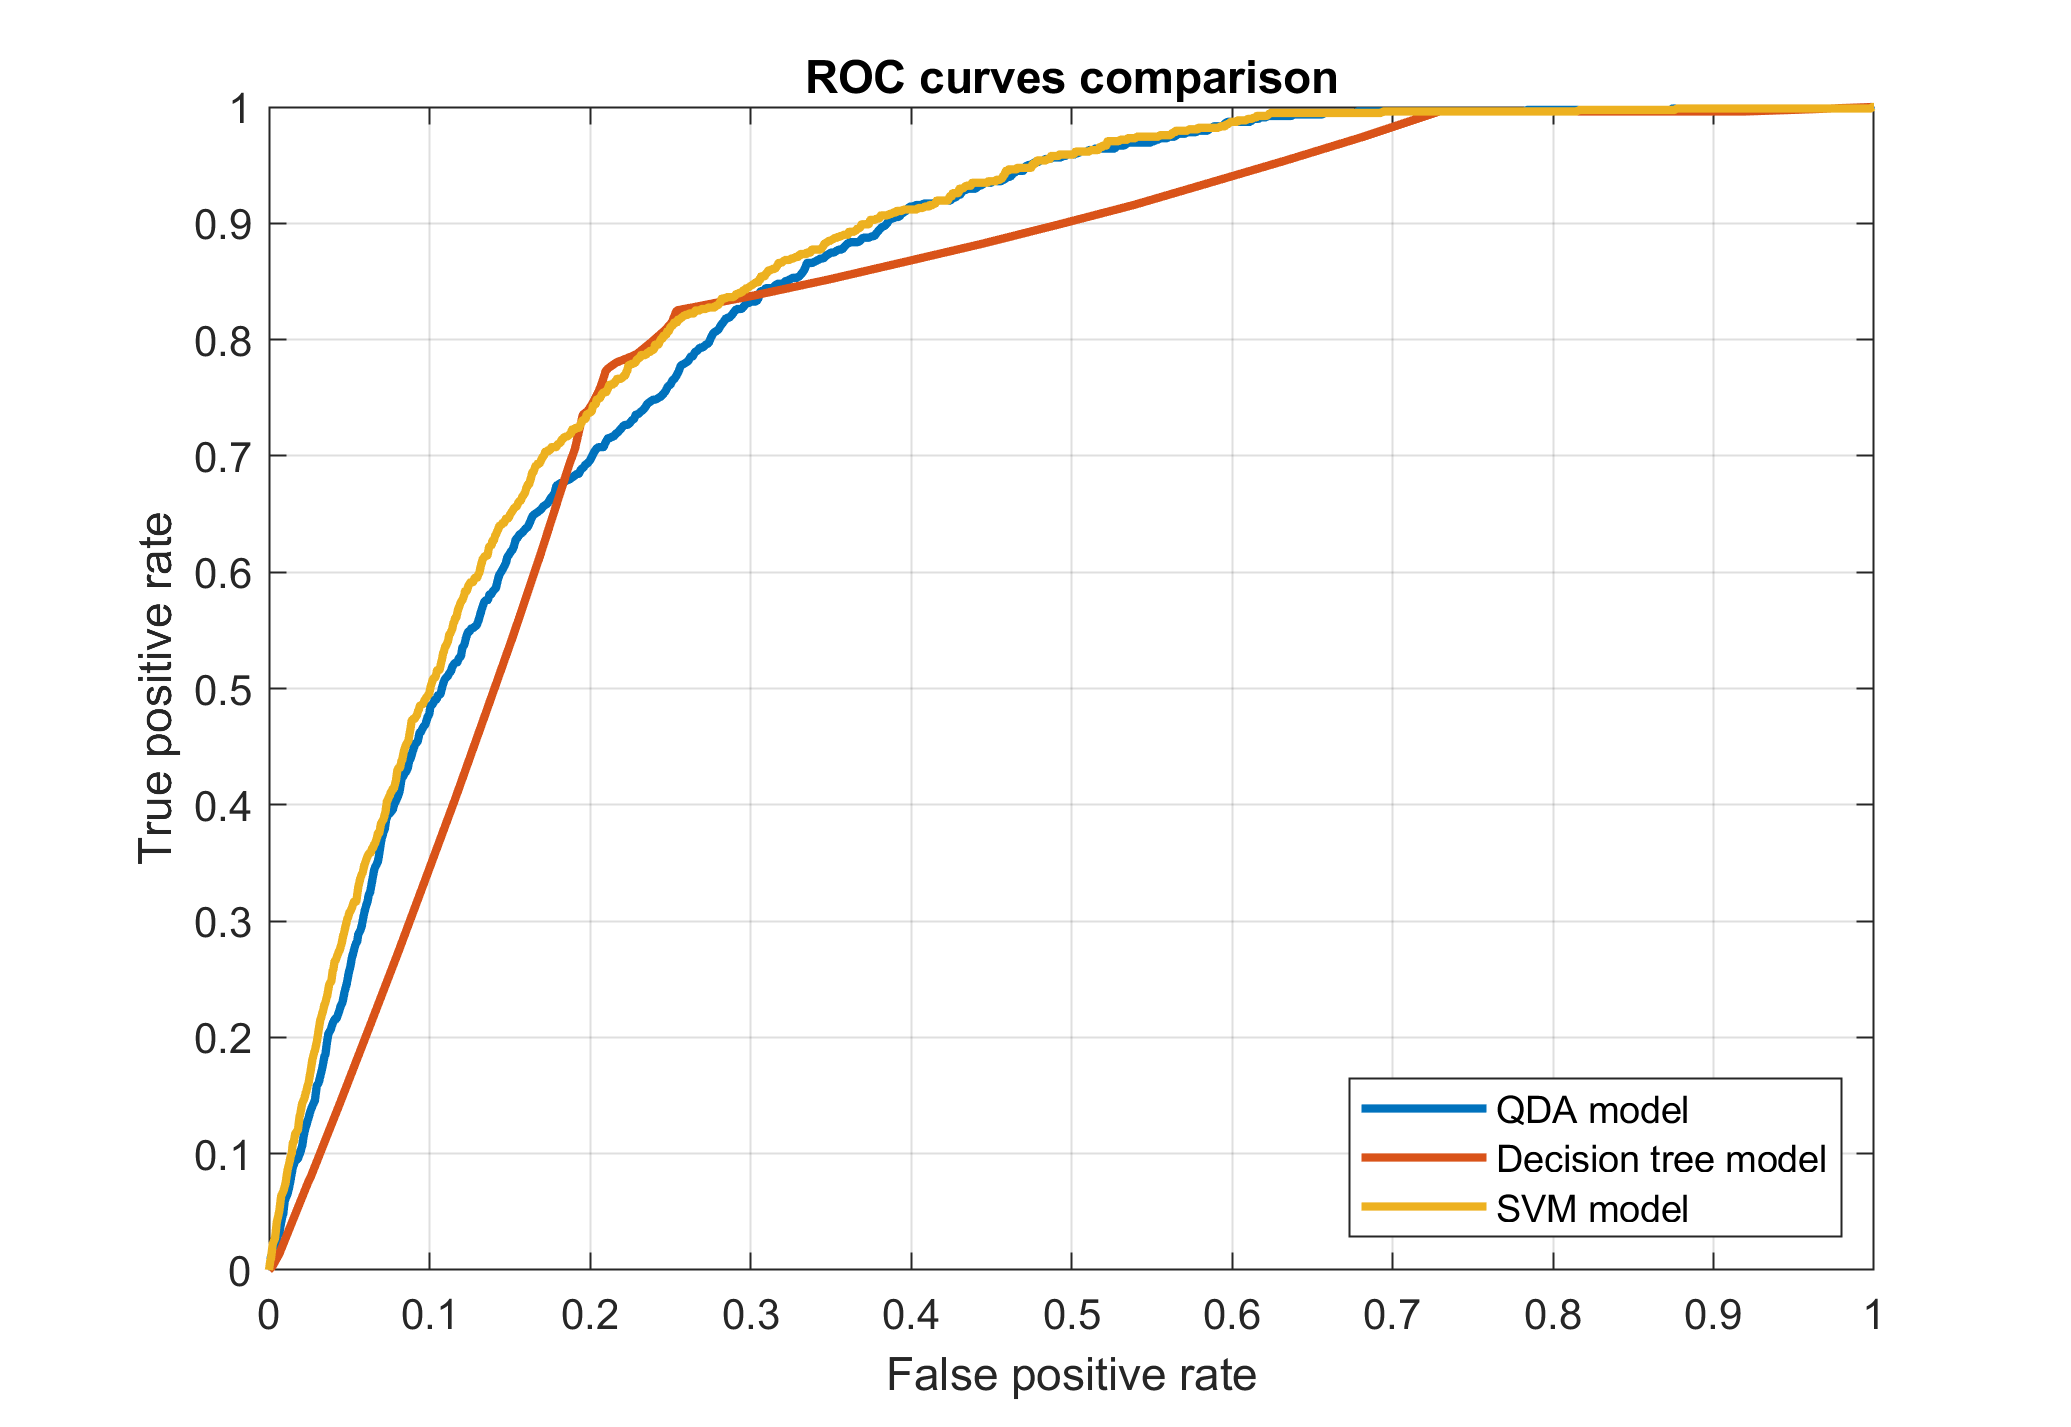
A graphical depiction of the ROC curves is also very useful

The best model in terms of AUC, a commonly used performance measure, is the SVM. Despite that, for various reasons I finally decided to choose the decision tree model as the best one.
Report can be found here and the two-page “executive report” here
link to data set
Comments
- That was my first time seriously doing model comparison and model selection so I probably made a lot of mistakes. I know, for instance, that the comparison is not completely legit because the models are not totally equivalent (i.e. different number of predictors and different ones).